
The Cost of "Plumbers Near Me": What Google Ads Bid Data Reveals About Every County in England
We take a deep dive look into how one search term can vary so much in terms of top and low page CPC across the counties of England.

Ask most people why Google Ads costs more in one place than another and they will give you the same answer: more people are searching, so there is more competition, so it costs more. It sounds obvious. It is also, according to the data, almost entirely wrong.
We looked at "plumbers near me", one of the most commercially valuable searches in the trades. It is a search made by someone with a leak, a dead boiler or a blocked drain, and it converts. Reaching that customer costs £3.08 a click in one part of England and £34.45 in another.
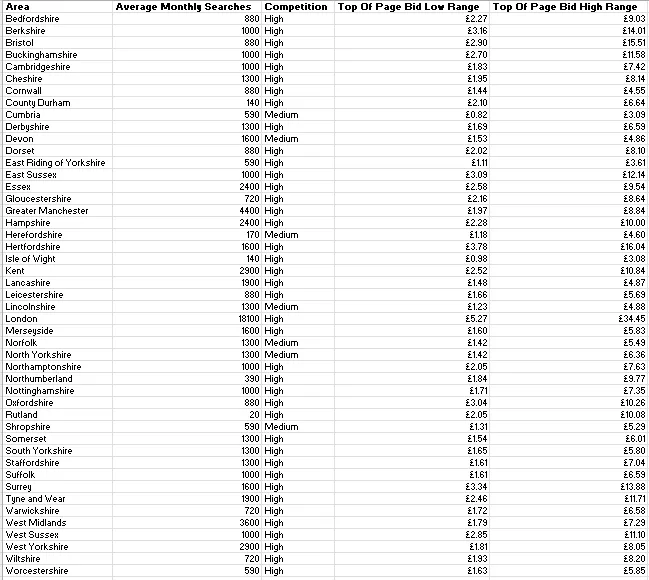
We pulled top of page bid estimates for the search term "plumbers near me" across all 47 ceremonial counties and metropolitan areas of England, alongside average monthly search volume and Google's own competition rating. What came back was a market that is far stranger and far less rational than the standard explanation allows.
Here is what the numbers actually say.
The data comes from Google's Keyword Planner, using location targeting set to each individual county. For every area we captured four things:
● Average monthly searches for the term, as a twelve month average
● Competition, Google's own High, Medium or Low rating for advertiser density
● Top of page bid, low range, the lower end of what advertisers have historically paid to appear at the top of the page
● Top of page bid, high range, the upper end of that same historical spread
One important clarification before we go further. These are bid estimates, not billed cost per click. What you actually pay is set by the auction and by your Quality Score, and a well built account frequently pays below the low range while a poor one can pay above the high range. Treat these as the market's price band rather than an invoice. They are still the best publicly available proxy for what a given local market costs, and the relative differences between areas are the useful part.
Search volumes from Keyword Planner are also rounded into buckets, which is why so many counties share identical figures. As it turns out, that rounding gives us something genuinely useful, which we will come back to.
One last point on the keyword itself. "Plumbers near me" is about as far down the funnel as a search gets. Nobody types it out of curiosity. It is someone with a problem, looking for a person to fix it, usually today. That matters for everything that follows, because it means every county in this dataset is being compared on identical intent. We are not weighing casual research in one place against ready-to-buy demand in another. When the same ready-to-hire customer costs £3.08 to reach on the Isle of Wight and £34.45 in London, the difference cannot be explained away by saying one market's traffic is better qualified than the other's.
The headline numbers
Across the 47 English areas:
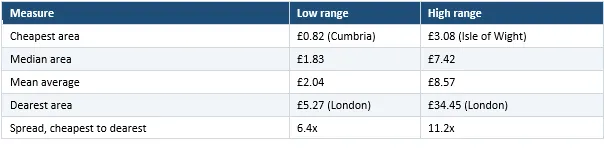
Google's national UK figure for the same term is £1.64 to £10.03 against 90,500 monthly searches. That national number is close to useless as a benchmark for anyone. Thirty one of the 47 English areas have a low range bid at or above £1.64, so most of the country sits above the "national" floor. Meanwhile only twelve areas exceed the £10.03 ceiling, because that ceiling is being hauled upwards by a single city.
Which brings us to the elephant.
Finding one: London is not an expensive market, it is a different market
London returns 18,100 monthly searches for "plumbers near me", nearly a quarter of the combined volume of every English county in the dataset. Its top of page high range is £34.45.
That is 11.2 times the Isle of Wight. It is 4.7 times the median English county. Its low range bid of £5.27 is higher than the high range bid in eight counties, meaning the cheapest realistic entry price in London exceeds the most expensive plausible click anywhere in Cumbria, Cornwall, Devon, Lancashire, Lincolnshire, Herefordshire, the East Riding or the Isle of Wight.
Put in budget terms: buying thirty clicks a month at the top of the range costs roughly £93 in Cumbria, £259 in Gloucestershire and £1,034 in London. Same trade, same search term, same month.
London is also the only area where the internal price band blows out. Everywhere else, the gap between the low and high bid is fairly disciplined. In London it is 6.5x, the widest in the country by a comfortable margin, which suggests an auction with a very long tail of advertisers willing to pay almost anything for the top slot.
The practical consequence is that any national average including London is distorted, and any agency benchmarking a regional client against a national figure is comparing them to a market they will never compete in.
Finding two: search volume barely predicts cost at all
This is the finding that upends the conventional wisdom, and it is worth spelling out carefully.
Want more insights like this?
Join thousands of marketers getting weekly tips and strategies.
Across all 47 areas, the correlation between monthly search volume and the high range bid is 0.77, which looks like a strong relationship. Remove London, and it collapses to 0.19. In other words, the apparent link between demand and price is almost entirely one data point pretending to be a trend.
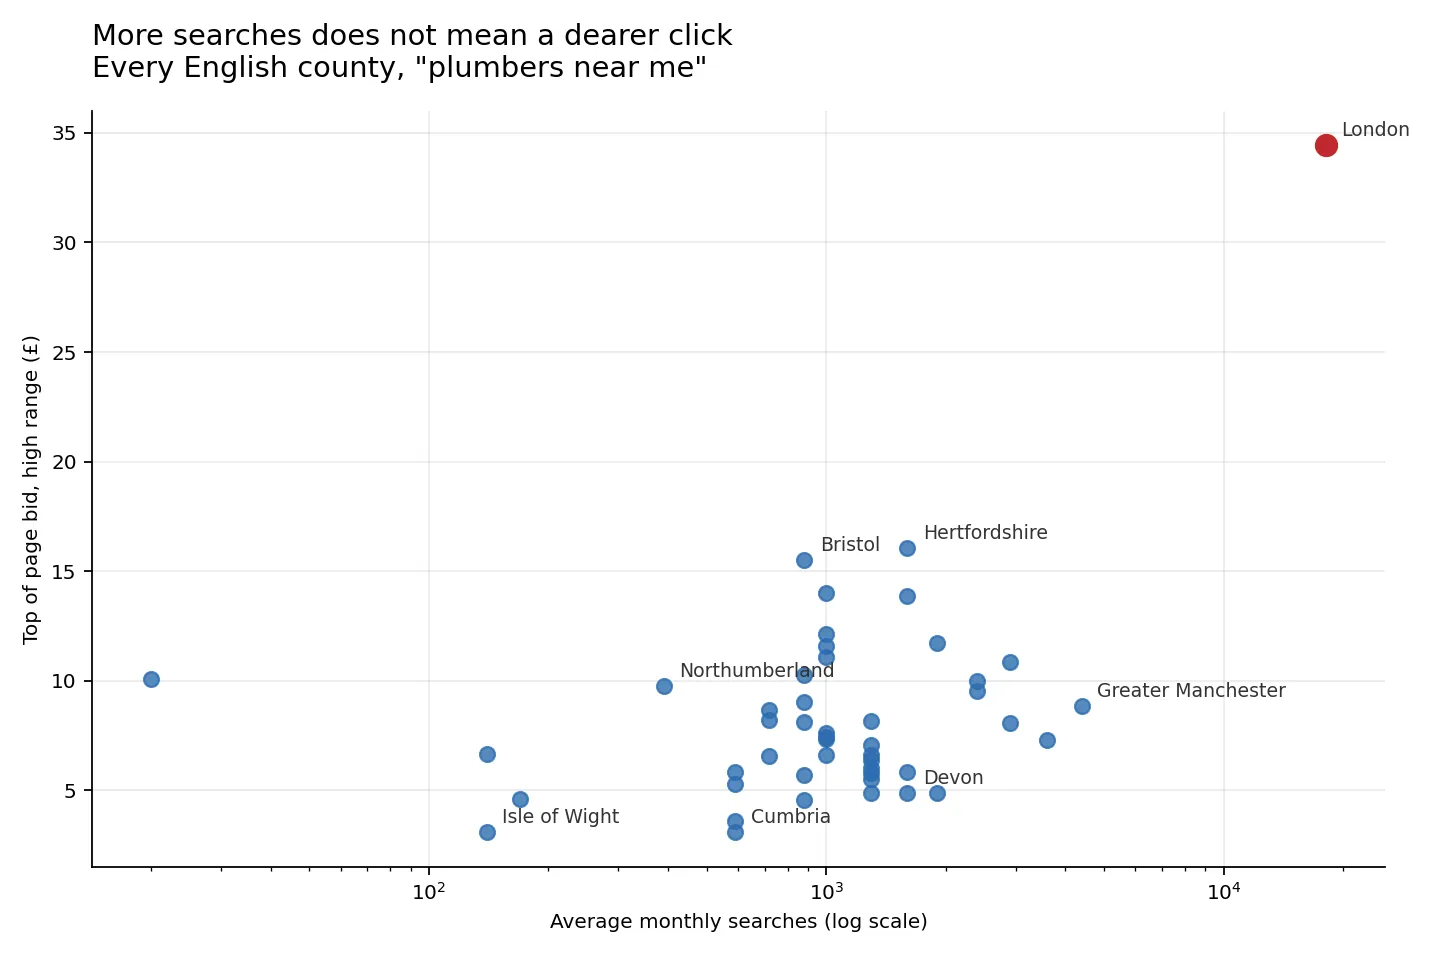
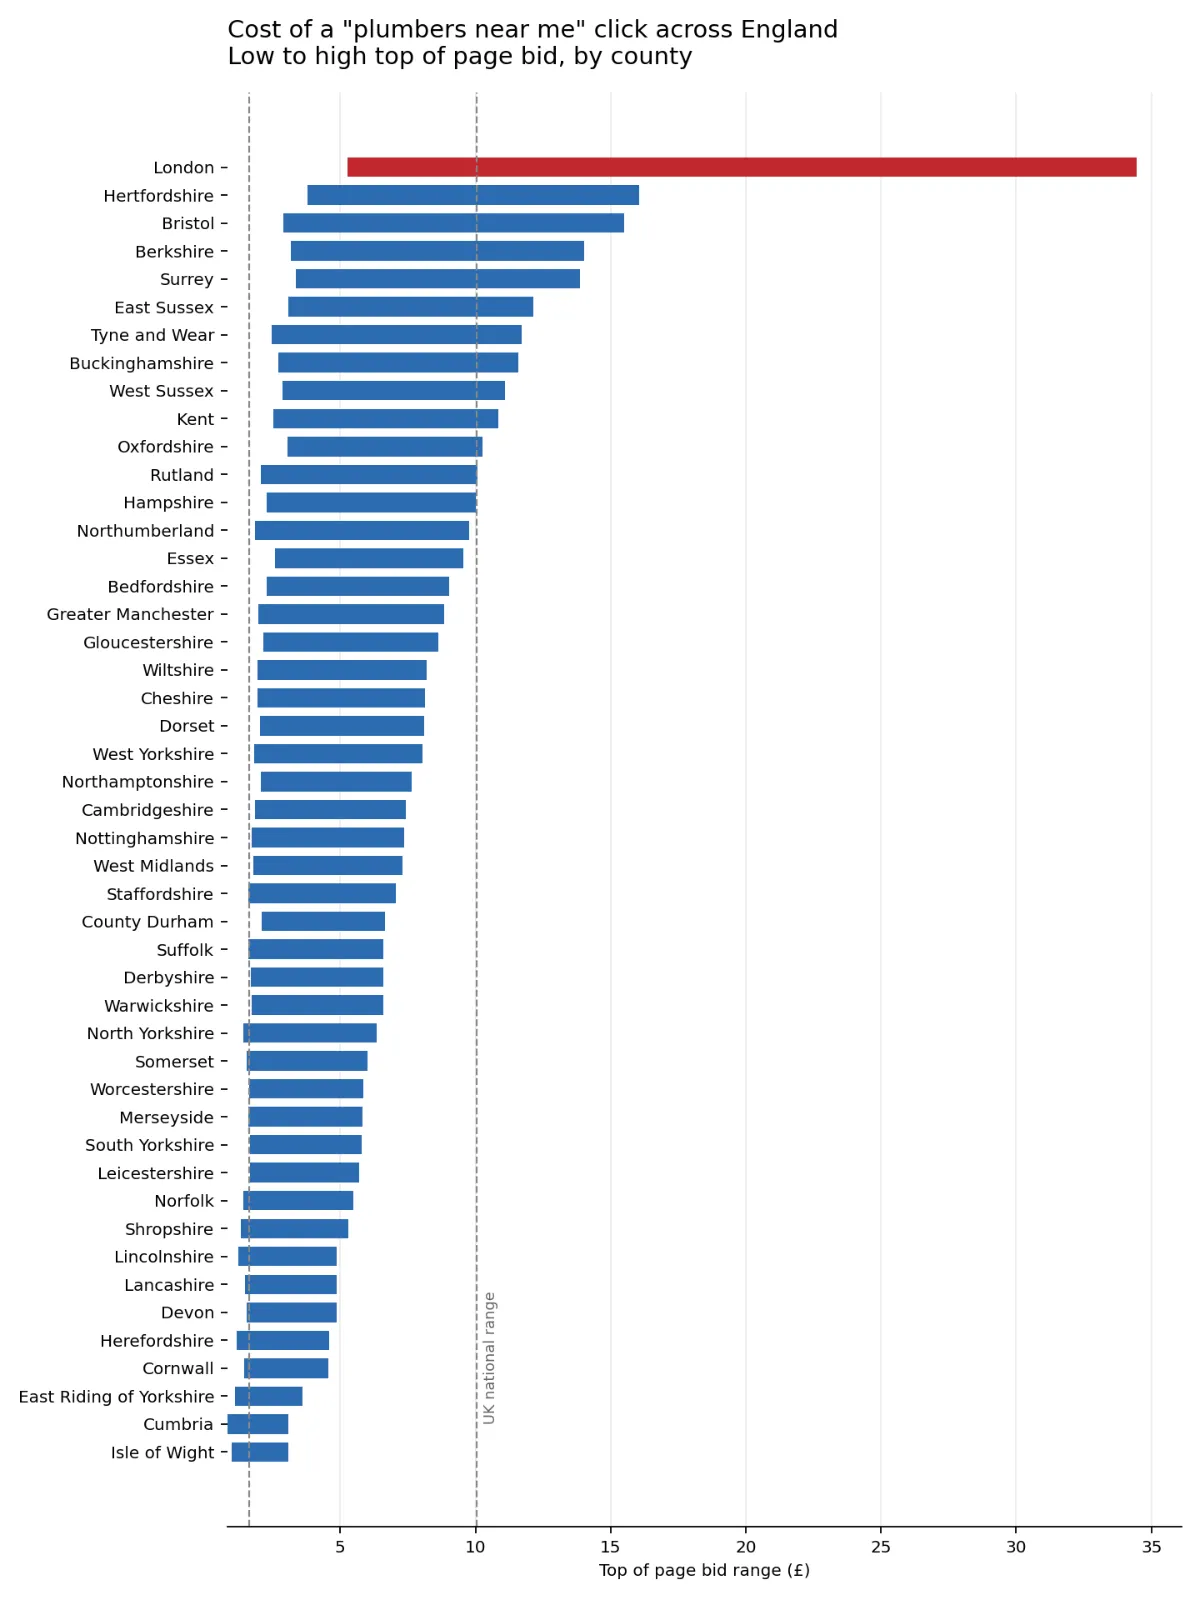
Split the counties into four groups by cost and the point becomes impossible to miss:
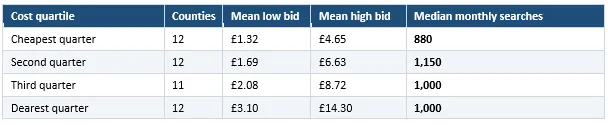
The top bid triples from the cheapest quartile to the dearest. Median search volume moves by essentially nothing. The dearest counties in England do not have more people looking for plumbers than the cheapest ones.
Because Keyword Planner rounds volumes into buckets, we can go further and compare areas with genuinely identical demand:

Devon and Hertfordshire have exactly the same number of people searching for a plumber each month. One costs more than three times the other. Whatever is setting the price, it is not demand.
Finding three: it is not a north south divide, it is a commuter belt
Group the counties by region and a pattern does appear, but it is not the one you would expect.
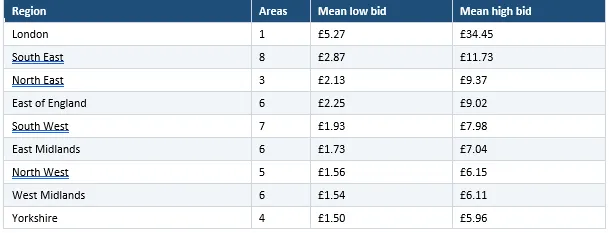
The crude north south split holds at first glance: the South excluding London averages £9.70 at the high range against £6.89 in the North and £6.57 in the Midlands. But the effect is not spread evenly across the South. It is concentrated in a ring.
Take the ten counties bordering or near London: Hertfordshire, Surrey, Berkshire, Buckinghamshire, Essex, Kent, East and West Sussex, Oxfordshire and Bedfordshire. Their mean high range bid is £11.84. The rest of England excluding London averages £6.95.
So the commuter belt costs 70% more than the rest of the country, while Cornwall (£4.55) is cheaper than Lincolnshire (£4.88) and Devon (£4.86) is cheaper than Lancashire (£4.87). Geography matters, but it is proximity to London and local household income that seem to drive it, not latitude.
Finding four: the North East does not behave like the North
The single most surprising result in the dataset is that the North East is the third most expensive region in England, sitting above the East of England and the entire South West.

Tyne and Wear is the seventh most expensive area in England, ahead of Kent, Hampshire and every county in the Midlands. Northumberland has just 390 monthly searches yet commands a £9.77 top bid, which puts it above Greater Manchester, a market eleven times its size.
There is no demand-side explanation for this. The most plausible reading is a small number of well funded advertisers, possibly national lead generation firms or a consolidated local player, bidding aggressively into a thin market with no one to stop them. It is a reminder that in low volume areas, a single determined competitor can set the price for everyone.
Finding five: the four times rule
For all the variation in absolute price, the shape of the auction is remarkably consistent. Divide the high range bid by the low range bid in each county and you get a ratio that clusters tightly around 4.0.
The median is exactly 4.0x. Half of all counties sit between 3.7x and 4.3x. The tightest is the Isle of Wight at 3.1x, the widest is London at 6.5x.
This is a useful planning heuristic. Whatever your local market costs at the bottom, the realistic ceiling is roughly four times that. If you know your area's floor is around £1.50, you can expect a competitive top of page position to run to about £6, and you can size a budget accordingly without needing to guess.
There is one caveat. The spread ratio correlates with price level (0.77 across all counties, 0.61 excluding London), so expensive markets do not just cost more, they are also more volatile. The dearer your area, the less reliable that four times rule becomes, and the more the difference between a well optimised account and a lazy one will show up in your bank balance.
Finding six: "competition" does not mean what most people assume
Of the 47 areas, 40 are rated High competition and 7 are rated Medium. Not a single one is Low.
Here is the part that catches people out. The Medium competition counties have a higher median search volume (1,300) than the High competition counties (1,000). They are not quieter markets. They are markets with fewer advertisers fighting over them.

The seven Medium areas are Cumbria, Devon, Herefordshire, Lincolnshire, Norfolk, North Yorkshire and Shropshire. Devon in particular stands out: 1,600 monthly searches, one of the busiest markets in the country, at a £4.86 top bid. On a pure demand-per-pound basis it is one of the best value markets in England.
Google's competition metric measures advertiser density, not consumer demand. A Medium rating on a high volume county is not a warning, it is an opportunity.
Where the value actually is
If you divide monthly search volume by the high range bid, you get a rough measure of how much demand each pound of bid ceiling buys you.
Best value markets: Greater Manchester (4,400 searches at £8.84), West Midlands (3,600 at £7.29), Lancashire (1,900 at £4.87), West Yorkshire (2,900 at £8.05) and Devon (1,600 at £4.86). Large, busy markets where the price has not caught up with the volume.
Worst value markets: Rutland (20 searches at £10.08), Northumberland (390 at £9.77), Bristol (880 at £15.51), Berkshire (1,000 at £14.01) and Oxfordshire (880 at £10.26). Thin demand, heavy prices.
Bristol deserves a special mention. With 880 monthly searches it is a mid-sized market, yet its £15.51 top bid makes it the third most expensive area in England, behind only London and Hertfordshire. Its internal spread of 5.3x is the second widest in the country. Something unusual is happening in the Bristol auction, and any advertiser targeting the city on a South West budget is in for a shock.
The limitations worth stating
Good analysis says what it cannot tell you.
Search volumes are rounded. Keyword Planner buckets its figures, so "1,300" could be anywhere from roughly 1,100 to 1,500. This is fine for the broad comparisons made here but not for precise modelling.
Small areas have unreliable data. Rutland returns 20 monthly searches. A £10.08 top bid derived from that sample is close to meaningless, and County Durham (140), the Isle of Wight (140) and Herefordshire (170) should all be read with caution.
County targeting is not how anyone actually advertises. Real plumbing campaigns run on radius targeting around a base, or on postcode districts. County averages smooth over enormous internal variation, and the difference between central Manchester and rural Cheshire inside the North West figure will be substantial.
One keyword is one keyword. "Plumbers near me" is the highest intent end of the market, which is exactly why it is worth studying, but it is not the whole picture. Research-stage terms like "how much does a plumber cost" and specific service terms like "boiler repair" or "emergency plumber" will price differently, and the geographic pattern may not hold across all of them.
This is a snapshot. Bid estimates move with seasonality and with competitor activity. A cold snap in January will change these numbers considerably.
What to take from this
For anyone running or advising a plumbing business, three things follow from the data.
Your national benchmark is worthless. The £1.64 to £10.03 UK figure describes almost nobody. Pull the numbers for your actual targeting area before you set a budget, because the range between English counties is wider than most people's entire margin.
Cost is not a proxy for opportunity. The dearest quarter of England has no more demand than the cheapest quarter. If you are in a high cost county, you are not in a busier market, you are in a more crowded one, and the money that would win you the top slot might work harder on landing page quality, on Local Services Ads, or on ranking organically for the same term.
Look for the mismatch. The genuinely interesting markets are the ones where volume and price have come apart: Devon, Lancashire, Greater Manchester, Lincolnshire. High demand, moderate prices, and Medium competition ratings in several cases. For a multi-location operator or a franchise deciding where to expand, that gap is worth more than any headline search volume figure.
The underlying lesson is one that applies well beyond plumbing. Google Ads prices are set by how many advertisers want a click and how much they can afford to pay for it, not by how many customers are looking. Once you stop reading cost as a signal of demand, the map starts making a great deal more sense.
Ian
Ian has worked in Digital Marketing for decades, and is a Google Partner for Google Ads and an expert in onsite and technical SEO. He has worked with hundreds of clients, helping them achieve success online, through SEO, PPC and Digital Marketing, working with local businesses through to national retailers.
View all posts →Related Articles

Choosing A Pay Per Click Management Agency - How To Find The Right One For Your Business
When it comes to pay per click advertising, many business owners face a critical decision that could make or break their online marketing efforts. Do you manage your PPC campaigns in-house, or do you...

How To Increase ROI In Google Ads
Google Ads can be one of the most profitable marketing channels for your business, but it can also be one of the fastest ways to burn through your budget if you're not careful.

Does Quality Score Matter In Google Ads In 2026?
As we navigate through 2026, many advertisers are questioning whether Quality Score still holds the weight it once did in Google Ads campaigns. With Google's continuous algorithm updates and the rise...